Learning 1: Industry and Business Model are Key
The industry a startup operates in, and the business model it employs, are closely correlated with a startup’s success – whether measured in turnover, valuations or the amount of funding it obtains. For valuations, for instance, the industry a startup operates in represents the very most important predictor for its valuation, followed by its age and business model. Figure 1 shows the features ranked by their importance for valuations for a Random Forest Model after training.

Figure 1: Feature Importance for Valuations
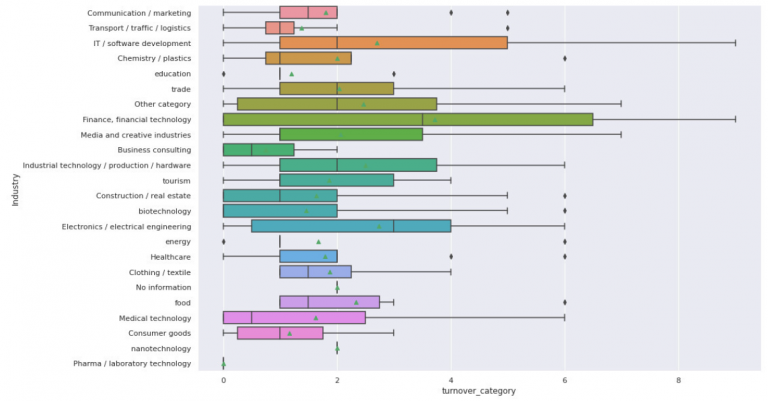
The boxplots of Figure 2 compare the turnover of startups between different industries, with the aim of demonstrating the impact and differences between industries. The green triangle marks the turnover means. It is important to mention that the horizontal axis states turnover in categories from 0 to 9 – which should be interpreted similarly to a logistic scale: for instance, the difference between categories 8 and 9 is magnitudes larger than the difference between categories 1 and 2. [2] Nevertheless, it is clear that the industries of FinTech, Software Development and Electronics are among the most lucrative ones for startups in Austria. Figure 2: Comparing startups’ Turnover in different Industries
For business models, in general the data suggests that the more digital and scalable they are , the higher is the likelihood of a startup to perform well.
These findings were further confirmed by flexible working hours being significantly and positively related to higher valuations. While it is unlikely that flexible working hours per se are of so much impact, they represent a good indicator on how digital a startup’s industry and business model are: for instance, in manufacturing or gastronomy, flexible working hours are much more difficult to offer than in software development.
Learning 2: Social startups focus on less lucrative and scalable Business Models and Industries
When simply comparing profit-driven startups, and ones primarily following social or ecological targets, based on their average turnover, valuations or funding amounts, social startups seem to face great disadvantages. However, drilling down deeper through the data, it becomes clear that social startups systematically are founded in less lucrative industries, and with less scalable business models – which is, to be fair, quite logical. For instance, industries like food or clothing provide more obvious opportunities for social improvement than FinTech or IT.
Figure 3 shows their differing distribution among industries compared to profit driven startups (white-ish the profit driven ones, and the social startups in blue). For example, one may note that not a single social startup that responded to the survey operated in the very lucrative FinTech industry. This phenomenon explains the largest part of disadvantage they face on average compared to profit-driven startups.
However, one must keep in mind that the sample employed for analysis was collected in March and April 2018. During the COVID-19 pandemic, it is likely that social startups are hit much harder than their more digitalized profit-driven counterparts. For this reason, I believe that policy makers should support social startups especially well in order for them to survive the current crisis.
 Figure 3: The Distribution of startups among Industries
One factor that was found to be negatively correlated with startup valuations was employee participation in the startup’s decision making processes. Such participation may conflict with and compromise a clear focus on profit maximization, which might make such startups less attractive investment cases. Social startups could be more inclined to offer such participation to their employees, in turn hurting their valuations.
Learning 3: Cooperation with larger Corporations pays off
After controlling for other factors, cooperations only with large corporations were still found to have significant positive effects on a startup’s turnover. This was not the case for cooperation with SME’s, universities, or other public institutions. One explanation may be that startups benefit significantly from their larger partners’ scale, established business relations and vast resources. Similarly, spin-offs from large companies experience benefits in turnover compared to independently founded startups, and other spin-offs.
Learning 4: A high Share of internal R&D benefits Sales
Moreover, the analysis showed clearly that startups‘ turnover benefits from a high percentage of product development performed internally. Outsourcing such a core value chain activity seems to hurt sales growth. One possible explanation may be the ability to tailor solutions closer to customer needs when developing products in-house. This is a finding that should also be of importance not only for startups, but may apply to all kinds of companies.
Further, there exists a weak correlation between employee cash bonuses and sales performance. However, this correlation was not significant.
Learning 5: Startups founded in Teams have easier Access to Funding
Notably, the amounts of funding and the valuations the average solo-founder obtains for his startup are significantly lower than for comparable startups founded by a team of entrepreneurs. This may stem from the wide anticipation of founding teams’ better performance among professionals and venture capitalists – which makes sense, since a team can deliver a wider range of complementary skills, more manpower, a more extensive professional network, and additional points of view towards a venture. However, within academia, whether teams actually perform better than solo entrepreneurs is heavily disputed, and evidence is inconclusive. Also, in the study at hand, there was no superior performance found for teams regarding turnover. After all, it may well be that solo founders have a harder time securing funding because venture capitalists are negatively biased towards them.
Another factor shown to have significant positive impact on funding amounts represent patents, which may result from their employment in the valuation process, or as an indicator for public sources of funding.
Methodology and Limitations
The analysis upon which this article is based was performed for a master thesis (“Quantitative Analysis of Startups’ Success Factors in Austria”). The data upon which this analysis is built was collected in the course of the ASM Survey 2018. The total sample size was 368 responses – which in turn varied slightly depending on data cleaning for the respective success indicators (turnover, valuations or external capital received.
As such, the results presented are prone to all kinds of limitations stemming from survey data, such as self-selection and biased answers.
In order to conduct analysis on the success factors of turnover, valuations and external capital received, survey data – which had originally been collected in nominal ranges of varying sizes – was transformed to ordinal categories from 0 to 9. This resulted not only in a loss of information, but also made analysis more complicated, as the data analysis task may be tackled both as a regression and classification problem. Analysis was conducted through meaningful data visualisation and interpretation, correlation analysis, t-tests and f-tests, Random Forest Analysis, and Generalized Linear Models (GLM).
If you are interested in more details, or in the whole master thesis upon which the article at hand is based, you are welcome to reach out to philipp.schardax@139.144.178.239 .
The data upon which the following analysis is built was collected in conjuncture by AustrianStartup, the Center of Entrepreneurship by Vienna’s University of Economics and Business, and Austria’s largest research organization, the Austrian Institute of Technology (AIT). We highly acknowledge all these organizations’ efforts and expertise in collecting the data.
[1] Put simply, Random Forest algorithms work by building a large number of decision trees and merge them, in order to produce a more accurate prediction. As such, they are very versatile regarding training data, and interpretation can be performed by plotting the importance of the variables analysed.
[2] For detailed interpretation of the categories, the following table must be employed:
| Ordinal Category | Nominal Range |
| 0 | No Turnover |
| 1 | €1 to €50,000 |
| 2 | €50,001 to €150,000 |
| 3 | €150,001 to €300,000 |
| 4 | €300,001 to €500,000 |
| 5 | €500,001 to €1 Million |
| 6 | €1 Million to €3 Million |
| 7 | €3 Million to €10 Million |
| 8 | €10 Million to €25 Million |
| 9 | More than €25 Million |